
Alert Before the Budget Burns: Practical SLO Alerting for Lean Teams
Many teams still page engineers when CPU, memory, or a single error-rate threshold crosses a line. The alert may be technically correct and operationally useless. A…
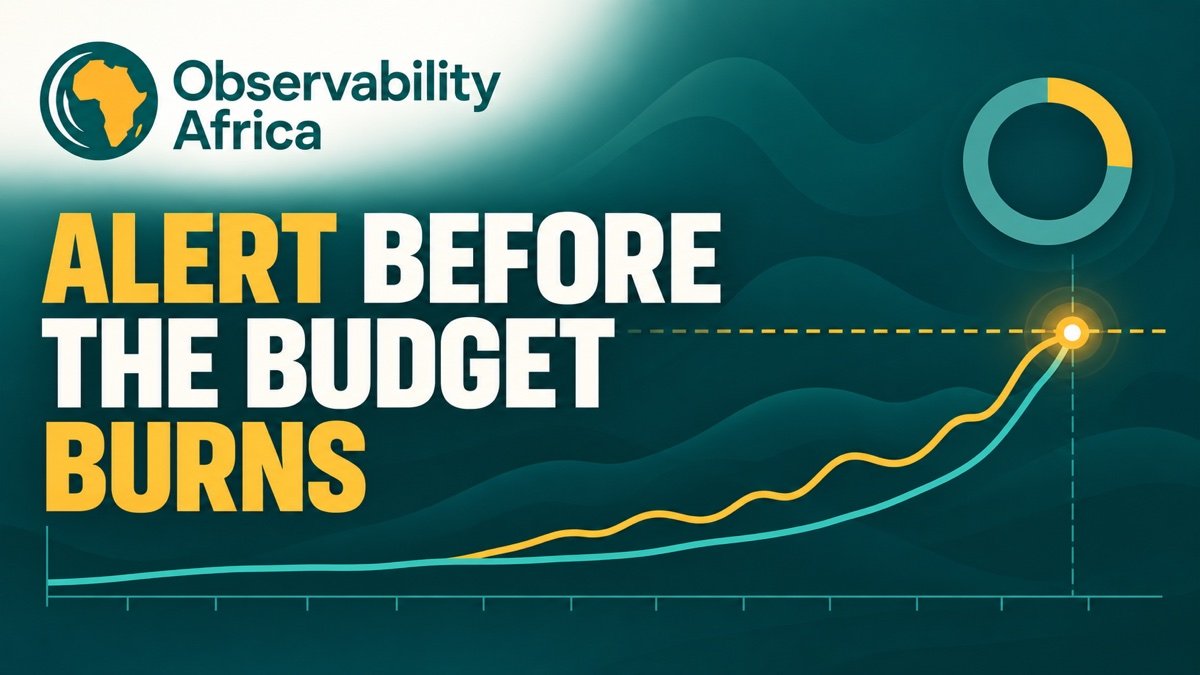
Many teams still page engineers when CPU, memory, or a single error-rate threshold crosses a line. The alert may be technically correct and operationally useless.
A better question is whether users are experiencing enough failed or slow requests to threaten the service level objective. Error-budget burn-rate alerts turn that question into an operating signal. They help teams page for urgent user impact, create lower-priority work for slower deterioration, and leave diagnostic metrics available without turning every anomaly into an interruption.
Start with a user-centered objective
An SLO attaches a target to a service level indicator. The indicator should describe what users receive, such as successful payment attempts, completed sign-ins, or requests served within a useful latency threshold.
OpenTelemetry describes an SLI as a measurement of service behavior and an SLO as a way to communicate reliability. Instrumentation can supply the metrics needed for that measurement, but telemetry does not decide which user journey matters. Product, engineering, and operations leaders must make that choice together.
Begin with one important service journey. Define:
- the event that counts as eligible;
- the condition that counts as good;
- the objective and measurement period;
- the data source and owner;
- the action expected when the budget is at risk.
If a metric does not represent user impact, keep it for diagnosis rather than using it as the primary paging signal.
Understand what burn rate means
An error budget is the amount of unreliability allowed by the SLO. Burn rate describes how quickly the service is consuming that budget relative to the planned rate.
A burn rate of 1 means the service would use the entire budget exactly by the end of the measurement period if the current rate continued. A burn rate above 1 consumes the budget faster. A high burn rate needs urgent attention because the team has less time to protect the objective.
This framing is stronger than an alert that says only that the error rate is high. The same error rate can have a very different meaning for services with different objectives, traffic levels, and user consequences.
Use two windows for urgent pages
A single short window detects problems quickly but can react to brief noise. A single long window is more stable but may take too long to notify the team.
Multiwindow burn-rate alerting combines both. The long window confirms that enough budget is being consumed to matter. The short window confirms that the problem is still active. Google’s SRE Workbook recommends this approach as a practical way to balance detection speed, precision, and reset time.
For a 30-day SLO, the workbook offers these starting points:
- Page when both a 1-hour and 5-minute window exceed a 14.4 burn rate.
- Page when both a 6-hour and 30-minute window exceed a 6 burn rate.
- Create a ticket when both a 3-day and 6-hour window exceed a burn rate of 1.
These are starting parameters, not universal promises. Validate them against your traffic, incident history, staffing model, and the consequences of failure.
Separate pages from tickets
A page should require an immediate human action. If the response can wait until normal working hours, create a ticket or review item instead.
This distinction matters for teams with small on-call rotations, distributed responsibility, or costly after-hours coverage. A fast burn threatens the budget quickly and may justify waking someone. A slow burn can still be important, but it often needs investigation, planning, or a controlled fix rather than an emergency response.
Keep resource alerts for hard limits and conditions that can cause immediate failure. CPU, memory, queue depth, and disk capacity remain valuable diagnostic signals. They simply should not page by default as a substitute for measuring user impact.
Handle low-traffic services differently
Burn-rate mathematics becomes noisy when the event count is small. One failed request in a quiet hour can produce an extreme error ratio even when the failure is isolated. This is common for internal services, overnight workloads, new products, and specialized business transactions.
Google’s guidance identifies several options:
- Use synthetic checks to create a consistent user-journey signal.
- Group related low-volume operations that share a meaningful service outcome.
- Reduce the impact of isolated failures through retries, fallbacks, or durable queues.
- Reconsider whether the SLO and alert window match the actual business consequence.
Do not add artificial traffic to a ratio without testing what it hides. Successful synthetic requests can dilute a real-user problem if the synthetic path does not experience the same failure.
Design the alert for the person receiving it
The notification should state what users are experiencing, which SLO is threatened, the burn rate and windows that fired, and the first useful investigation link. It should also name the service owner and include a runbook.
A practical alert description can answer five questions:
- Which user journey is affected?
- How quickly is the budget being consumed?
- Is the problem still active?
- Where should the responder investigate first?
- What safe action can reduce user impact?
The SLO dashboard should lead to diagnostic views for recent deployments, dependency health, traffic changes, error classes, saturation, and relevant traces. Our guide to protecting sensitive data in telemetry is also relevant here. Alert context should be useful without exposing tokens, personal data, or unrestricted request content.
Test alerts before trusting them
An alerting rule is production code. Test its calculations, routing, labels, and runbook links. Replay historical incidents where possible, or create synthetic time series that represent a fast outage, a slow deterioration, a brief spike, and a recovery.
For each scenario, record:
- whether the page fired;
- how long detection took;
- when the alert cleared;
- whether the expected responder received it;
- whether the alert led to a useful action.
Review every page after the event. If it was not actionable, fix the signal, routing, ownership, or runbook. Muting the symptom without understanding the design problem only postpones the next interruption.
A practical first implementation
- Select one important user journey with reliable event counts.
- Define the eligible and good events.
- Calculate the current SLI and agree on an initial SLO.
- Add recording rules for the required long and short windows.
- Create separate page and ticket policies.
- Test fast burn, slow burn, noise, and recovery scenarios.
- Review the result with product, engineering, and on-call owners.
Good alerting does not try to report every unusual metric. It protects the user promise and gives responders enough time and context to act.
Organizations that want to support vendor-neutral reliability education, practical workshops, or community resources can explore collaboration with Observability Africa. Sponsorship never determines our technical conclusions.
References
- Google SRE Workbook: Alerting on SLOs
- Google SRE Workbook: Implementing SLOs
- Google SRE Workbook: Being On-Call
- OpenTelemetry Observability Primer

About Abe Apithy
Abe Apithy is the founder of Observability Africa, a platform dedicated to helping telecom, fintech, and energy organizations design and scale resilient, high-performance digital infrastructure. His work focuses on enabling real-time system visibility, operational reliability, and performance optimization in environments where downtime, latency, and inefficiency…
Related guides

OpenTelemetry Collector Memory Limits: Preventing Backpressure from Becoming Data Loss
A practical guide to configuring OpenTelemetry Collector memory limits, understanding backpressure, and preventing data loss during traffic bursts or backend outages.
A Postmortem Is Not a Courtroom: How Lean Teams Learn Without Blame
A useful incident review explains how failure became possible. Learn how lean teams can build factual timelines, find contributing conditions, and turn lessons into verified improvements.
OpenTelemetry Service Naming: A Practical service.name Standard
Inconsistent OpenTelemetry service identity breaks service maps, dashboards, alert ownership, and incident response. Use a small identity contract to make telemetry dependable.